

Hello REALTORS®,
We often use building permit data to help advocate for Realtor interests with local government. It pays to keep accurate data. And it also can be a great resource for you.
I gather building permit data from the US Census Bureau, which is reported to them by our local governments. I think you will find my research useful. It is up to date through June 2025, so it’s easy to estimate the annual trend through the rest of the year. However, as I think we have all observed, the housing market has softened a bit in the third quarter.
Permits by County
I combined single-family and multi-family building permits because together they constitute housing units that can be occupied by families to meet their housing needs. However, only Greenville County has a meaningful number of multifamily housing permits. Year-to-date, about 1/3 of Greenville County’s permits are multifamily; they are almost 99% of the reported multifamily permits in the region. Remember, 2025 includes only the first six months of the year.
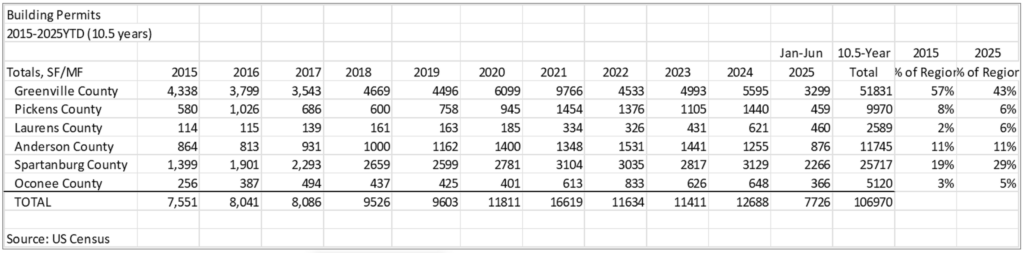
Homebuilding has rebounded since it softened somewhat in 2022 and 2023. However, 2021 was an unusually productive year; more than 50% higher than the 10-year average.
Greenville County continues to be the powerhouse in the Upstate with 43% of the homebuilding activity. But Greenville County’s share of the total building permits for the six-county region has fallen from 57% in 2015 to 43% in 2025. Spartanburg County now represents almost 1/3 of the new home production in the Upstate and while not in this report, Spartanburg County issued almost the same number of single-family building permits as Greenville County between January and June of this year.
The rest of the Upstate splits the remaining 28% of homebuilding activity. Anderson County is number three at 11%, the same share of the region it claimed in 2015. Anderson County is followed by Pickens County, Laurens County, and Oconee County. In fact, Laurens County has surged to 6% of the regional share of homebuilding from 2% in 2015 and has passed Oconee County for number five in the region.
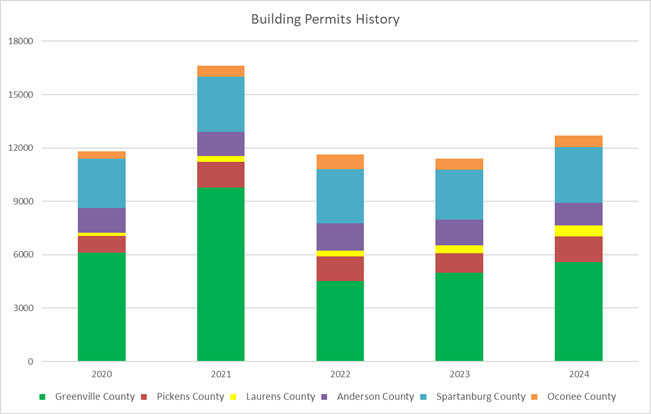
It pays to look at older data. While the graphs don’t show earlier years, Pickens, Anderson and Oconee counties all had much higher housing production in the mid 2000s. Recent trends mirror homebuilding levels between 2003 and 2007.
The graph below helps paint a picture of the last five years.
In a few weeks, after the elections, I will publish a report on the various cities and towns, and the unincorporated areas, broken out separately.
Elections
2025 is an election year—every year is an election year. This year, the various cities and towns will have town and city council seats on the ballot. In addition, Anderson County will vote on whether to impose a penny sales tax for roads and three precincts in Anderson County will vote on whether to impose zoning in their areas. I’ll start reporting on those elections next week.
Support RPAC
Elections are an important way that your association represents you and helps make a strong market for real estate. Through RPAC, your association supports pro-business candidates who understand the importance of a vibrant economy for real estate. You can help by supporting RPAC. It’s easy. Your association includes a voluntary contribution to RPAC on your annual dues invoice. Pay it, and you are a RPAC supporter. If you haven’t supported RPAC this year, I encourage you to do so by clicking here.
Michael Dey, Director of Government Affairs