

Hello REALTORS®,
We often use building permit data to help us advocate for Realtor interests. It not only pays to keep accurate data, but that data can be a great resource for you.
I gather building permit data from the US Census Bureau, which is reported to them by our local governments. Until recently, the monthly data is updated at the end of the following month. But since last year, the US Census has fallen behind. As of February 15, building permit data is only available through October 2025.
To provide you, and me, with a good snapshot of homebuilding in our area, I have used the available data to estimate the entire year. In other words, I divided the data by 10 and multiplied it by 12. That’s what you’ll find in this report, which is by county. In the next Watchdog Report, I’ll report on permits by place (cities and towns).
So, what does the data tell us? First, it tells us that it’s important to look at the data. If we listen to the media, homebuilding is down. That may be for other markets, but not the Upstate.
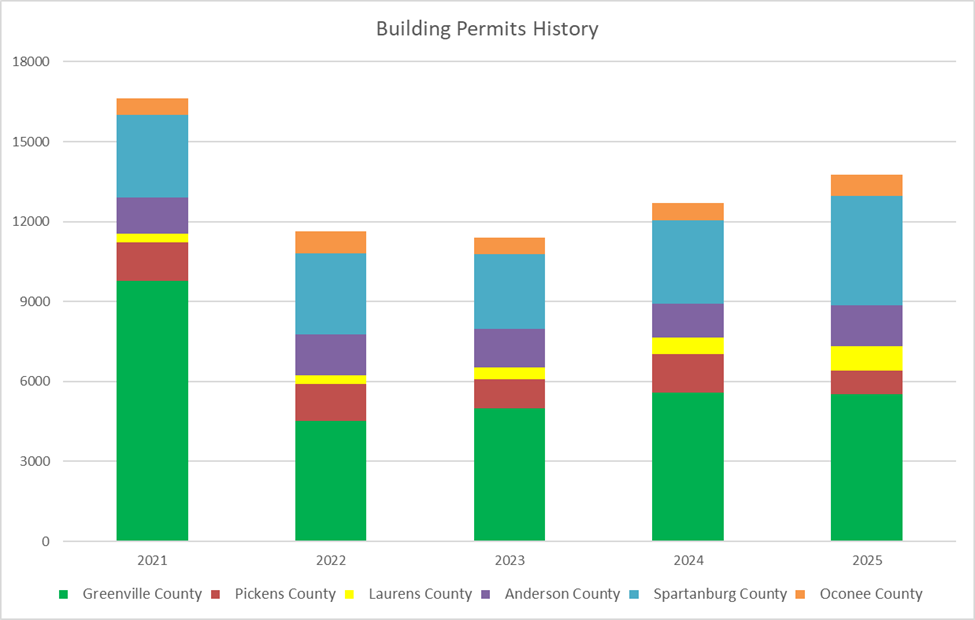
I combined single-family and multi-family building permits because together they constitute housing units that can be occupied by families. However, only Greenville County has a meaningful number of multifamily housing permits. In 2025, about 20% of Greenville County’s permits are multifamily, and almost 99% of the multifamily permits in the region.


Homebuilding has rebounded since it softened somewhat in 2022 and 2023. However, 2021 was an unusually productive year; more than 50% higher than the 10-year average.
Greenville County continues to be the powerhouse in the Upstate with 40% of the homebuilding activity. But Greenville County’s share of the total building permits for the six-county region has fallen steadily from a high of more than 60% 20 years ago to 40% today. Spartanburg County now represents almost 1/3 of the new home production in the Upstate and while not in this report, Spartanburg County issued almost as many single-family building permits as Greenville County in 2025.
The rest of the Upstate splits the remaining 30% of homebuilding activity. Anderson County is number three at 11%, about the same share of the region it claimed in 2016. Anderson County is followed by Pickens County, Laurens County, and Oconee County. In fact, Laurens County has surged to 7% of the regional share of homebuilding from 1% in 2016, and has passed Oconee County for number five in the region.

And Pickens County tells the tale of the impact of lengthy moratoriums. After a year-long moratorium in the county, and an 18-month moratorium in Easley, homebuilding fell 62%. But those permits just moved to other counties. Overall, homebuilding was up 8% in the region in 2025.
It pays to look at older data too. While the graphs don’t show earlier years, Pickens, Anderson and Oconee counties all had much higher housing production in the mid 2000s. Recent trends mirror homebuilding levels between 2003 and 2007. In other words, there’s a lot of homebuilding, but the 10-year average for new home starts across the region is 11,319 permits. However, the average 2015-2019 was 9,413 permits. I think homebuilders are just catching up to meet pent up demand.
Next week, I will publish a report on the various cities and towns, and the unincorporated areas, broken out separately.
Support RPAC
Elections are an important way that your association represents you and helps make a strong market for real estate. Through RPAC, your association supports pro-business candidates who understand the importance of a vibrant economy for real estate. You can help by supporting RPAC. It’s easy. Your association includes a voluntary contribution to RPAC on your annual dues invoice. Pay it, and you are a RPAC supporter. If you haven’t supported RPAC this year, I encourage you to do so by clicking here.
Michael Dey, Director of Government Affairs